
Why Is My Shopify Store Not Profitable? The Real P&L Breakdown
You open Shopify and the homepage looks fine. Orders, revenue, a line trending up. Then you look at your bank balance and it tells a different story. That gap is the reason we built Marjn, and it comes down to one thing: your dashboard shows revenue, and revenue is not profit. Here is the full walkthrough of where the money actually goes.
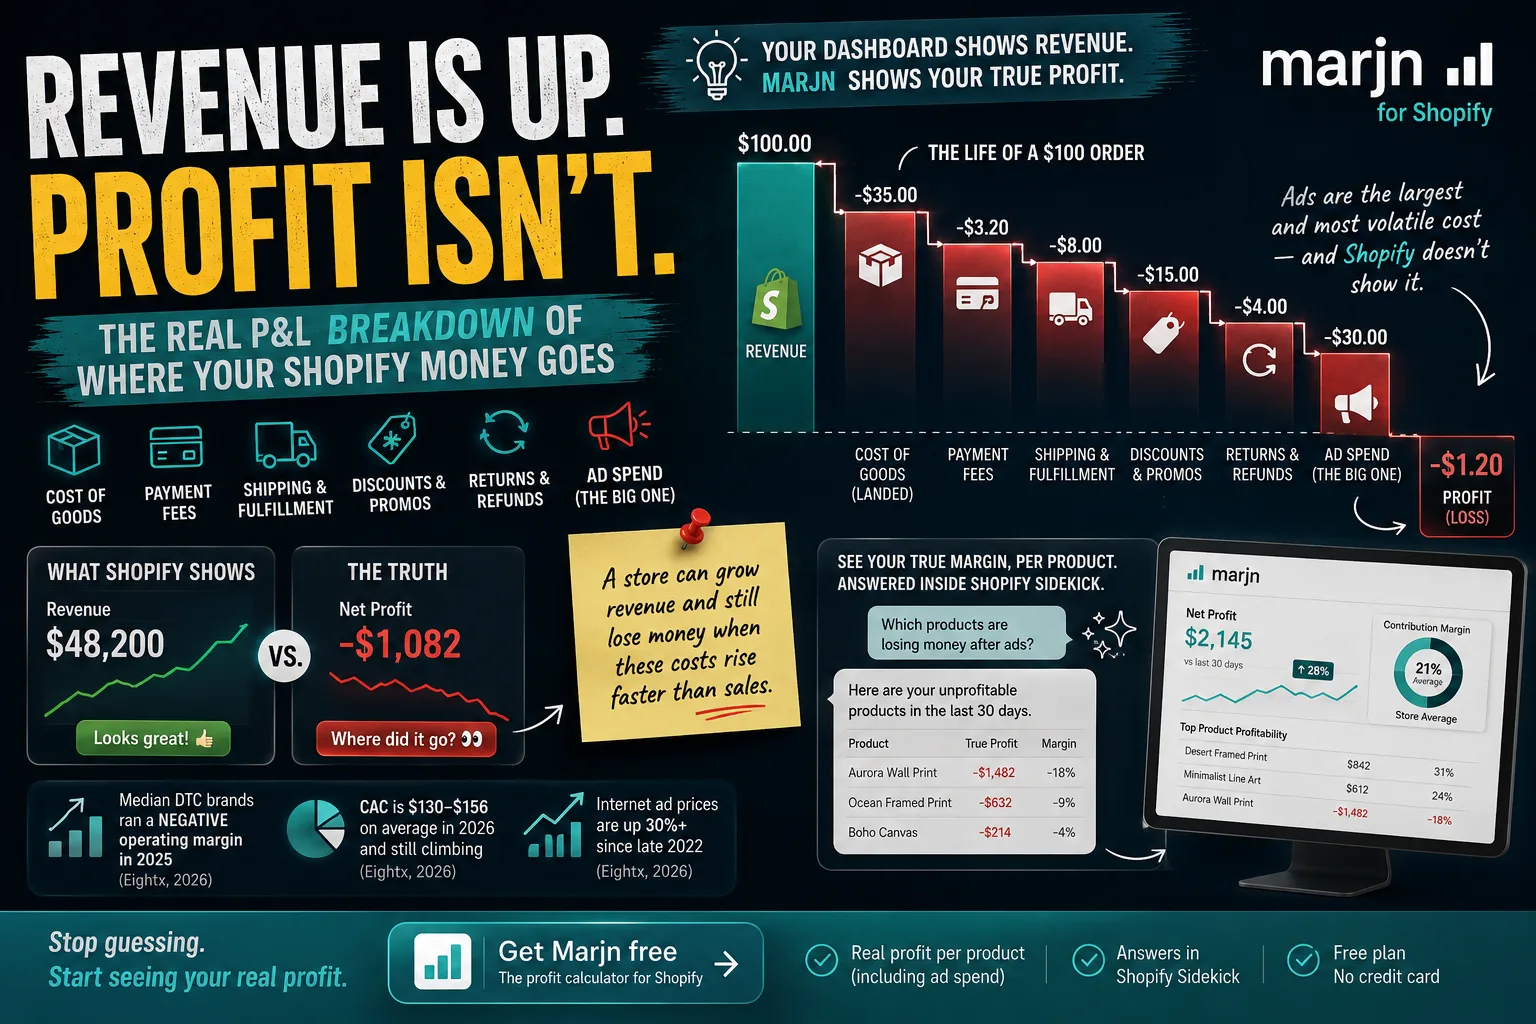
A Shopify store makes sales but no profit because revenue is only the top line. After landed cost of goods, payment fees, shipping, discounts, returns, and ad spend come out, little or nothing is left. Shopify shows revenue, not true net profit, so the dashboard can look healthy while the bank account does not. Marjn rebuilds that profit-and-loss per product, including your ad spend, and answers it inside Shopify Sidekick.
Where does the money go on a Shopify order? In order: cost of goods, payment fee, shipping, discounts, expected returns, then advertising. Advertising is usually the largest and most volatile line, and it is the one your dashboard leaves out.
The short version
- Revenue growing while profit shrinks is a margin problem, not a sales problem.
- Six lines stand between a sale and profit: goods, fees, shipping, discounts, returns, and ads.
- The median public direct-to-consumer brand ran a negative operating margin last year on a healthy-looking 47 percent gross margin (Eightx, SEC data, 2026).
- Shopify Analytics reports revenue and, at best, a partial gross profit. It never sees your ad spend.
- Marjn folds landed cost and ad spend into your margin and answers it inside Sidekick.
Let me walk you through a real one. When we build demos we use a fictional store called Loft & Ember, and its numbers look great on the surface: $48,200 in revenue for the month, a best-selling Aurora Wall Print, orders flowing. On the Shopify homepage this is a business that is winning. Follow one product all the way down, though, and the picture changes.
Revenue is the top line, and it is the only line Shopify makes obvious
When a customer pays $100, Shopify records $100 of revenue. That number is real and it is also the least useful number you own, because none of it is yours yet. Everything that follows is the story of that $100 leaving.
Shopify's default reporting stops almost immediately after revenue. It shows orders, sessions, conversion rate, and average order value. If you have carefully entered a cost-per-item for every variant, it shows a gross profit. It does not show what you paid to acquire the customer, it does not always pull payment fees correctly, and it reports shipping as an average rather than per order. So the profit many owners glance at is a partial gross figure with the biggest cost of all left out. That is the whole answer in one sentence: you have been reading a revenue tool as if it were a profit tool.
The six lines between a sale and profit
Take one $100 order and walk it down. Your numbers will differ, but the shape holds.
1 Cost of goods sold, the landed cost
What the product actually cost you in hand: the item, inbound freight, duties. The mistake is using the supplier sticker instead of the landed cost. A print that costs $30 from the supplier might land at $35 once you count freight. On this order, say landed cost is $35. You are down to $65. This is the line Marjn fixes first, because it lets you set the true landed cost per product and holds it even when Shopify's cost field is blank.
2 Payment processing fees
Every card charge takes a cut. Shopify Payments runs 2.9% plus 30 cents on Basic and Shopify, down to 2.4% plus 30 cents on Plus (Bloom Analytics, 2026). On a $100 order that is about $3.20. You are down to about $61.80.
3 Shipping and fulfillment
What you charge for shipping and what it costs you are rarely the same. Free shipping is a discount you pay on every order. Assume $8 of real cost you are not fully recovering. You are down to about $53.80.
4 Discounts and promotions
The welcome code, the sitewide sale, the abandoned-cart offer. Discounts come straight out of margin, and they cluster on your most-promoted products. A 15% code takes $15 more. You are down to about $38.80, and your dashboard still says this was a $100 order.
5 Returns and refunds
Processing a single return runs $15 to $30 or more once you count inbound shipping, labor, and restocking (Bloom Analytics, 2026). Spread across every order, call it $4 baked into this one. You are down to about $34.80. Marjn nets out cancellations and refunds so your margin reflects orders that actually stuck.
6 Advertising, the line your dashboard never shows
If you spend on Meta or Google to bring customers in, a share of every order's revenue was really the cost of getting that customer to checkout. This is usually the single largest deduction. If advertising works out to $30 against this order, you have $4.80 left. At $40, you just lost money on a sale your dashboard is celebrating. This is the line Marjn Pro folds in, because it is the one Shopify and Sidekick cannot see.
Why revenue can rise while profit falls
The reason profit erodes over time is that the sixth line keeps getting more expensive. Internet ad prices are up more than 30 percent since the end of 2022, and Meta CPMs climbed for years before peaking above $25 in late 2025 (Eightx, 2026). Median direct-to-consumer brands now spend between $130 and $156 to acquire a single customer (Eightx, 2026). When acquisition cost rises and your price and product cost stay put, the sixth line grows while the first five hold, and margin quietly bleeds out.
Cold paid traffic is often the least profitable channel a store has. In one 2026 analysis, cold Meta acquisition carried a negative 22 percent contribution margin, while email and SMS retention ran at a positive 77 percent (Eightx, 2026). A store that grows entirely on cold ads is buying revenue at a loss and hoping the second purchase makes it back. This is not a sign you are doing something uniquely wrong. The median public direct-to-consumer company, with finance teams and dashboards you do not have, ran a negative 2.4 percent operating margin last year on a 47 percent gross margin. Their gross margin looked fine. Their bottom line was underwater.
See your real margin, per product, inside Sidekick
Marjn rebuilds the profit-and-loss above from your Shopify order revenue, your landed cost, and your Meta ad spend, then answers margin questions right inside Shopify Sidekick. Ask which products lose money after ads and get a real number. Free plan, no card.
Get Marjn free →Gross margin, contribution margin, and net margin are not the same
Three words get used interchangeably and mean very different things. Getting them straight is most of the battle.
| Term | What it subtracts | What it leaves out |
|---|---|---|
| Gross margin | Cost of goods only | Fees, shipping, returns, ad spend |
| Contribution margin | All variable costs to fulfill and acquire the order, including ad spend | Fixed overhead |
| Net margin | Everything, including fixed overhead | Nothing, this is the true bottom line |
Shopify's cost-per-item field, when filled in, gets you a version of gross margin. That is why a store can show a 70 percent gross margin and still lose money on the order: gross margin does not know about the ad spend, the discount, or the shipping. The number you need to run ads and set prices is contribution margin, because it is the first one that includes the cost of acquiring the customer. A real case of a strong-looking ROAS that still lost money is in why a good ROAS can still lose you money.
What Marjn does with this
Everything above is a monthly spreadsheet you could build by hand once. The trouble is it goes stale the moment you change a price, run a sale, or shift ad budget, and it cannot tell you which products are the losers hiding inside a healthy average. That is the gap Marjn fills. It reads your live Shopify order revenue, applies the landed cost you set per product, folds in your connected Meta ad spend on Pro, and gives you the same P&L above for any product on demand. Then it answers the question where you already work: open Shopify Sidekick and ask which products are losing money after ads, and Marjn replies with a real number instead of a revenue figure.
In the Loft & Ember demo, that is the moment the Aurora Wall Print, a clear bestseller on revenue, turns out to have a negative true profit once its ad spend is counted. The dashboard was cheering for it. Marjn shows why you should not.
What Marjn shows on Free versus Pro
Because the honest answer depends on which costs you can feed in, Marjn splits along exactly that line. On the Free plan, Marjn reads your Shopify order revenue and the cost you have set in Shopify's own cost-per-item field, then reports true margin per product and across the store and answers it inside Sidekick. That already beats the dashboard, because it turns revenue into a real gross-margin view and flags the products where the cost field is empty instead of pretending they run at 100 percent margin.
On Pro, you add the two things that make the number honest for a store running ads: a landed-cost override that holds your true cost per product even when Shopify's field is blank or wrong, and your connected Meta ad spend folded into the margin so the figure reflects money that actually left the business. Pro also raises low-margin alerts so a product that slips underwater tells you, rather than waiting for you to go looking. The split is deliberate: the sixth line in the walkthrough above, ad spend, is the one no dashboard shows, so it is the one the paid plan exists to bring in.
Neither plan asks you to leave Shopify. You do the setup once, then the answers come back where you already work, in Sidekick, in plain language. You ask which products are losing money after ads, and Marjn replies with the products and the numbers.
Why a live answer beats a monthly spreadsheet
The by-hand version of this P&L is worth doing once, and it has one fatal weakness: it is a photograph of a moving thing. The moment you launch a sale, change a price, or shift ad budget between campaigns, the margin on every affected product moves, and your spreadsheet is now describing a store that no longer exists. Most owners rebuild it quarterly at best, which means for three months at a time they are steering on numbers that are already stale.
A live view removes that lag. Marjn recomputes from your current Shopify data every time you ask, so the margin you see reflects today's prices, today's discounts, and this period's ad spend, not a snapshot from the start of the quarter. That matters most exactly when it is hardest to track by hand: during a promotion, when discounts spike and margins compress fastest, or right after you scale a campaign, when ad spend jumps and a product can cross from profit to loss in days. The whole point of putting the answer inside Sidekick is that you can check it in the moment you are about to make the decision, not weeks later when the money is already spent.
The most common places the money hides
When merchants finally run this math, the loss almost always concentrates in one of a few spots.
- Ad spend on cold traffic. The single biggest and most volatile line, and the one Shopify never shows.
- Your best sellers. The products you promote most carry the heaviest discount and ad load, so a bestseller can be your biggest loser. We break that down in why your bestseller is your biggest loser.
- Free shipping you are not recovering. A margin leak on every order.
- A wrong or empty cost-per-item field. If landed cost is missing for some variants, every downstream margin for them is fiction, which is exactly why Marjn lets you override it.
- Discount stacking. A welcome code on top of a sale on top of free shipping wipes out margin on an order that still counts as full-price revenue.
The fix is never "sell more." It is to find the line and the products that are underwater, then change the price, cut the discount, or turn off the campaign buying revenue at a loss.
Notice how many of those culprits are invisible on the Shopify dashboard specifically. Ad spend is not there at all. Free shipping never shows up as a line item. A wrong cost field silently reports a product as more profitable than it is. Discount stacking still counts as full-price revenue. The dashboard is not hiding these things out of malice; it was built to report sales, and it reports them well. It was never built to report profit, and asking it to is the mistake. The moment you accept that and put a profit tool next to it, the store stops being a mystery. You can see which line is eating you and which products are carrying the store, and you can act on the real ranking instead of the flattering one.
Frequently asked questions
Why is my Shopify store making sales but no profit? Revenue is only the top line. After landed cost, fees, shipping, discounts, returns, and advertising, what is left is often small or negative. Shopify shows revenue, so the dashboard can look healthy while the bank balance falls. Marjn rebuilds the per-order P&L including ad spend.
Does Shopify show my profit? Not fully. It shows revenue, orders, and, if you fill in cost-per-item for every variant, a gross profit. It does not include ad spend, does not always pull gateway fees correctly, and averages shipping.
How does Marjn calculate true profit margin? It combines your Shopify order revenue with the landed cost you set per product and, on Pro, your connected Meta ad spend, nets out cancellations and refunds, and reports true margin per product and across the store, answered inside Sidekick.
What is a good net profit margin for an ecommerce store? Around 10 percent is a common average, above 20 percent is strong, under 5 percent is a danger zone. Dropshipping sits near the low end; branded direct-to-consumer brands can reach 25 to 45 percent.
Why does my profit shrink as my revenue grows? Usually rising customer acquisition cost. If you scale spend without watching contribution margin per order, you add sales and subtract profit at the same time, especially on cold paid traffic.